Costs and Benefits of Data Provision (2011)

Overview

This report presents case studies exploring the costs and benefits that Public Sector Information (PSI) producing agencies and their users experience in making information freely available, and preliminary estimates of the wider economic impacts of open access to PSI. In doing so, it outlines a possible method for cost-benefit analysis at the agency level and explores the data requirements for such an analysis – recognising that few agencies will have all of the data required.

Analysis of the open data initiative by Geoscience Australia is covered in section 3.2 which concludes that benefits may be around 13 times the costs in terms of revenue foregone.

Geographical scope

Australia

Non-quantified impacts

It is clear from the case studies presented that even the subset of benefits that can be measured outweigh the costs of making PSI more freely and openly available. It is also clear that it is not simply about access prices, but also about the transaction costs involved. Standardised and unrestrictive licensing, such as Creative Commons, and data standards are crucial in enabling access that is truly open (i.e., free, immediate and unrestricted). What this study demonstrates is that the direct and measurable benefits of making PSI available freely and without restrictions on use typically outweigh the costs. When one adds the longer-term benefits that the study cannot fully measure, and may not even foresee, the case for open access appears to be strong.

Quantifiable impacts

Exploring the case of Geoscience Australia (GA) topographical data, PwC noted a total cost of production circa 2009-10 of AUD 13.3 million (i.e., the revenue that would be earned in a cost recovery model), and marginal cost of distribution, based on the cost of 2008-09 web downloads, of AUD 1,842 or just 0.01%, and so they set marginal cost to zero. Government’s share of purchases was estimated at 50%. Despite a long discussion on elasticity of demand and possible multiplier effects, PwC assume both the elasticity and multiplier to be 1.

Their computed welfare impacts of free provision of GA topographical data relative to cost recovery included:

  • An agency loss of AUD 13.3 million per annum in revenue foregone.
  • A gain for government users of AUD 10 million per annum, of which AUD 6.65 comes in access costs saved and the remainder from additional use and distributional changes in deadweight loss.
  • A gain for private consumers of AUD 8 million per annum, of which AUD 6.65 comes from access costs saved and the remainder from additional use and distributional changes in deadweight loss.
  • An overall increase in net welfare of AUD 4.7 million per annum, as the net welfare impact on government is negative (i.e. AUD -3.3 million per annum). If this is extrapolated to annual Australian government expenditure on fundamental spatial data of around AUD 70 million, it would suggest net welfare benefits from providing free access over cost recovery of around AUD 25 million per annum.


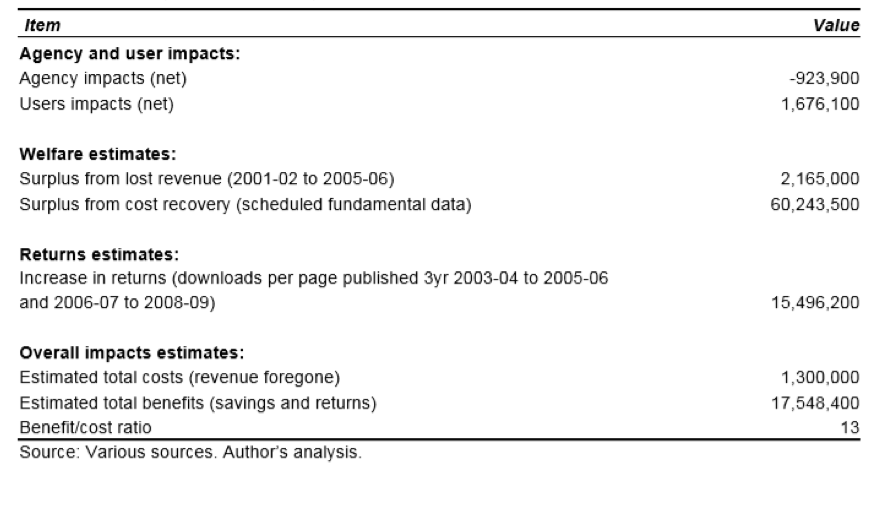
Revenue trends are also difficult to interpret. Between 2001-02 and 2002-03, Australian government revenue from sales of spatial data fell by AUD 2.8 million, of which around AUD 700,000 was from scheduled datasets. Over the period 2001-02 to 2005-06 revenue from sales of scheduled datasets fell by AUD 1.5 million per annum, and the difference between 2001-02 revenue and the annual average for the subsequent years was AUD 875,000 per annum for scheduled datasets and AUD 1.2 million for all datasets. Hence, the range for revenue lost might be of the order of AUD 700,000 to AUD 1.5 million per annum. DITR (2004) reported a revenue loss by Geoscience Australia of AUD 1.3 million per annum, which would suggest an annual increase in consumer surplus of around AUD 2.2 million. Taking average annual government expenditure on fundamental data over the period 2001-02 through 2005-06 as indicative of the costs that would have been recovered under a cost-recovery regime, suggests an annual consumer surplus increase of around AUD 60 million.

Approximate estimates suggest possible agency savings on transactions of around AUD 375,000 per annum and revenue losses of AUD 1.3 million per annum. Conversely, users’ savings include both (approximately AUD 1.7 million per annum). PwC (2010) computed welfare impacts of free provision of GA topographical data relative to cost recovery and noted an overall increase in net welfare of AUD 4.7 million per annum. The impacts of the observed increases in use, as indicated by trends in scheduled datasets available and delivered over the period 2001-02 through 2005-06, on average social returns to annual expenditure on data collection suggest an increase in social returns of some AUD 15 million. Hence, the benefits may be around 13 times the costs in terms of revenue foregone (see figure below).

Summary of spatial data case study annual costs and benefits (circa 2005-06)

Reference

Region

Study type

Analysis of download volumes and application of multipliers

Economy sector

Public Sector Local Government